It is often said that a better Gross Domestic Product is good for the economy, good for jobs and thus good for the country. How many times has this been repeated so that we come to accept it as truth? As we shall see, it is not. And there are much better ways of seeing how well people are doing – but they tell a very different story from GDP and are thus inconvenient to Power and consequently rarely used as tools for the measurement of prosperity.
Gross Domestic Product (GDP) is really only a direct indicator of how well business is doing, and therefore that part of the population that benefits from the limited jobs on offer. What distorts the equation is the fact that most of the profits disappear from the local economy with very small amounts of taxes being paid in. Using GDP as a measure of prosperity also conceals how well the country’s population as a whole are doing.
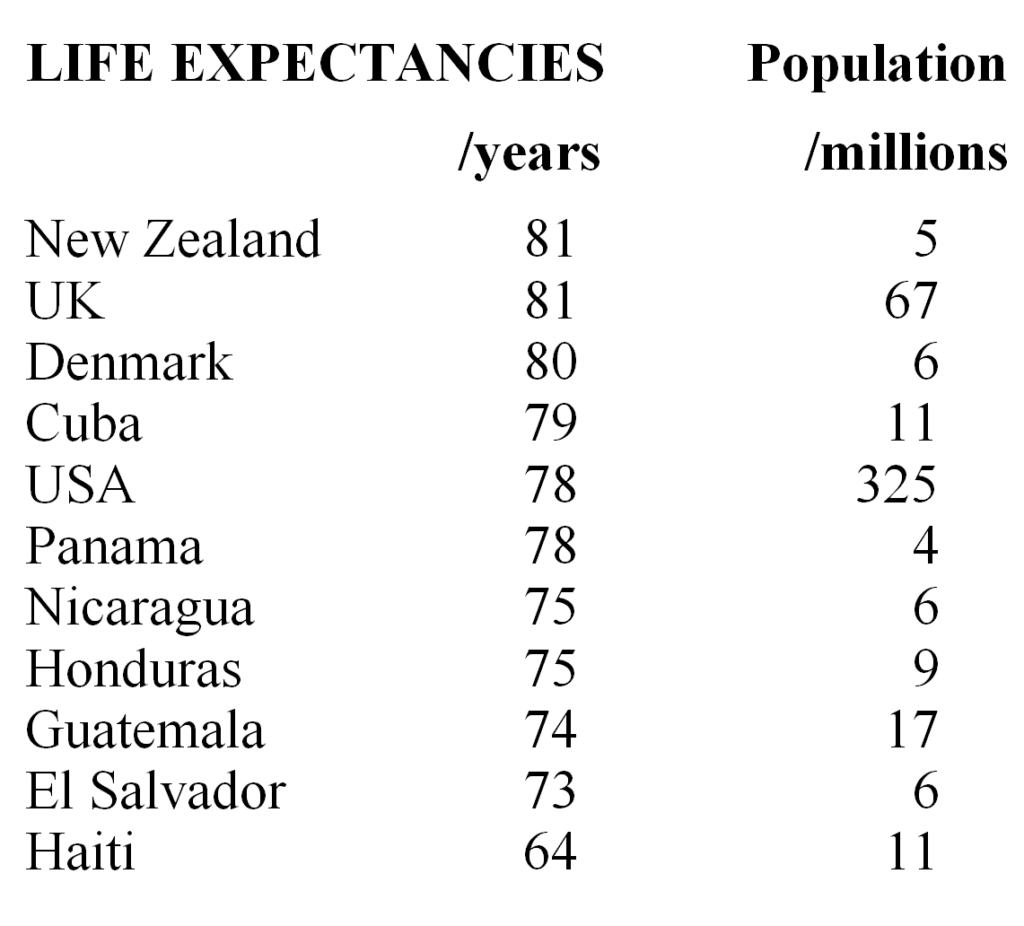
Now we have seen the political record of the countries of Central America and the Caribbean we can now look at how well these regimes are actually caring for their people by the crucial indices that really matter – life expectancy, the health of the population, infant mortality and levels of education, namely literacy.
We will look at the most recent year where all the facts are available, namely 2017. The population data is taken populationpyramid.net, the figures for GDP are taken from the CIA’s World Factbook, and the Health statistics are taken from “The Global Burden of Disease”, a major study published in the Lancet in 2017. See link below.
https://ourworldindata.org/causes-of-death#what-do-people-die-from.
We include Denmark and New Zealand in these statistics as two examples of countries that regularly feature as two of the best places in the world to live. We also include the UK and the USA to give some comparison of how these two “advanced” countries compare.
Healthcare Comparison.
In this comparison I include the World Health Organisation’s vaccine-preventable diseases that are also include in the Lancet publication – hepatitis B(h), meningitis(m) and tuberculosis(tb). I also include preventable deaths, i.e. diarrheal diseases (dd), HIV, nutritional deficiences (nd), protein energy nutrition (pen) and malaria(ma).
I divide the total deaths from the above by the total population and multiply by 1000 to give the national index (NI) so that we can directly compare countries as follows…
Denmark 331dd+66nd+34pen+29tb+27hiv+ 7h + 34m + 0ma = 528/5.7m.
NI=0.093
New Zealand 71dd+18tb+10hiv+10nd+7pen+ 3h + 14m+0ma = 133/4.7m
NI=0.028
UK 1226dd+388tb+264hiv+145nd+100pen+ 64h + 290m+0ma = 2,477/66.7m
NI= 0.037
USA 9506dd+7343hiv+4905nd+4292pen+939tb+ 1081h + 1426m+0ma = 29,492/325m
NI=0.09
Haiti 3703dd+3850hiv+1021tb+647nd+591pen+ 95h + 857m+9ma = 10,773/11m
NI=0.98
Cuba 361HIV +277dd+60nd+43tb+42pen+ 11h + 100m+0ma = 894/11m
NI=0.08
El Salvador 728hiv+319dd+240nd+239pen+90tb+ 15h + 95m+0ma = 1,726/6.4m
NI=0.27
Guatemala 2957dd+2047nd+1917pen+700hiv+408tb+ 47h + 364m+13ma = 8,453/16.9m
NI=0.5
Nicaragua 590hiv+184dd+138tb+100nd+97pen+ 15h + 56m+3ma = 1183/6.4m
NI=0.185
Honduras 1229dd+426tb+213nd+151pen+63hiv+ 69h + 110m+35ma = 2,296/9.4m
NI=0.244
Panama 526hiv+198tb+173dd+114nd+106pen+ 9h + 50m+0ma = 1,176/4.1m
NI=0.287
When we look at this combination of preventable deaths and deaths from vaccine-preventable diseases, we see that New Zealand with a National Index of 0.028 is clearly the best performer. The UK actually performs considerably better than Denmark and so it should be said that we can be prouder of our NHS than other Institutions in the UK.
The USA’s private health system performs more than twice as poorly as the UK. And only marginally better than Nicaragua. And worse than Cuba.
When we compare Caribbean countries we see that communist Cuba, one of the USA’s “axis of evil” countries, and the subject of constant trade embargoes over the previous decades has managed very well to care for its people. By contrast we see Haiti, which in spite of the beneficent attentions of the USA since they first invaded 120 years ago, installing a succession of Dictatorships, has a healthcare system that is worse than Cuba by a factor of 12. You are 12 times more likely to die of something preventable in Haiti than you are in Cuba.
In Central America, we look at how the people of Honduras, El Salvador, Panama and Guatemala are treated in their US-dominated countries compared to their neighbours in Nicaragua, a very sad indictment emerges.
Nicaragua is the clear leader in the region, with all the others, bar Guatemala, closely clustered. Guatemala, which has experienced the greatest degree of oppression comes in a very poor last place. You are more than two and half times more likely to die of something preventable in Guatemala than you are in Nicaragua.
Cuba and Nicaragua, the two countries in the region that have fought bloody revolutions to oust US influence and achieve genuine independence also have by far the best record for actually looking after their people. Co-incidence? Let’s switch our attention to take a look at levels of education, i.e. levels of literacy.
The data is from the United Nations Educational, Scientific and Cultural Organization (UNESCO) in 2018. It is presented in 3 age groups – 15-24, 24-65 and 65+, which I have averaged proportionately out 1:3:1 to form the overall picture.
Finishing in 8th place on the overall world list is Cuba with my averaging system putting this country on a literacy rate of 99.7%. Panama, Honduras and El Salvador all come in at 85.8%, Guatemala at 77.8%, with Haiti on a withering 45.4%. Again there is a striking correlation between those nations most oppressed by the United States and those that have secured their independence. The only apparent anomaly to this conclusion would at first glance appear to be Nicaragua on 74%. How do we explain this one apparent contradiction to the model that national populations do better without the “help” of the United States?
Cuba had its revolution in 1959, so by the time of this survey, all its citizens have been educated in post-revolutionary Cuba. It is most striking that in the 65+ age category, literacy in Cuba runs at 99.2%. The next best in this age category is 81% in Panama, with the others around 65%, barring Guatemala on 50.7% and pre-revolutionary Nicaragua on 49.2%.
Nicaragua had its revolution in 1979 so we can look at literacy rates both before and after the revolution. The 65+ age category at the time of the survey in 2005 would be a minimum age of 39 in 1979, i.e. they finished school at least twenty years before the revolution. Their literacy rate is 49.2%. Thereafter we see the literacy rate increase to 78% for 24-65s and then 87% for 15-24 year olds, in other words a vast improvement after the revolution when, prior to this, the country had the lowest levels of literacy in Central America.
Infant Mortality (2021)
When we look at infant mortality rates there are once more good straight line correlations compared to the health statistics above.
Measured as number of deaths per thousand live births…
Cuba 4.4 Panama 9.9 El Salvador 16.8 Honduras 17.2 Nicaragua 18.3 Guatemala 21.3 Haiti 46.8
Gross Domestic Product.
So then finally in this section we can look at GDP per capita and see what this tells us about our conclusions above.
GDP – US dollars per capita in 2017 (apart from Cuba 2016).
Denmark 50,000
New Zealand 39,360
UK 43,178
USA 59,570
Haiti 1,807
Cuba 11,681
El Salvador 8,890
Guatemala 8,183
Nicaragua 5,656
Honduras 4,859
Panama 24,251
When we compare GDP with the healthcare performance for each country there is certainly no straight line correlation. And there is certainly no excuse for the USA turning in a worse healthcare performance than Cuba considering it has A GDP per capita that is more than 5 times bigger.
While one might be able to excuse Haiti’s dreadful performance based on its GDP, itself partially a result of the 2010 earthquake, why should Nicaragua’s healthcare performance be so much better than its near neighbours El Salvador and Guatemala when it only has around two thirds of their GDP? And how is Nicaragua able to comfortably beat Panama’s healthcare provision with less than a quarter of their GDP per capita?
As I stated in the earlier section “About the Style” in this book, this is not the point at which to leave questions hanging without offering the answers that spring out from clearly apparent correlations within the data. So let us take the radical step of actually proceeding to the conclusions.
1. US client States do not have the interests of their citizens at the forefront of their minds compared to those countries that have managed to free themselves from the regional superpower.
2. GDP is not a reliable indicator of how well the citizens are actually doing. It depends how much of the GDP the Government decide to allocate on health and education.
3. The United States and its clients are quite happy to withhold public spending and see much poorer health and education outcomes.